2026-012
Effect of New Zealand blackcurrant extract on rest and walking-induced cardiorespiratory and metabolic responses in young adult Southeast Asian women
Willems, Mark E. T.; Wannasorn, Sorrawit; Leelitthum, Kawissara; Ajjimaporn, Amornpan; Nana, Alisa
European Journal of Applied Physiology
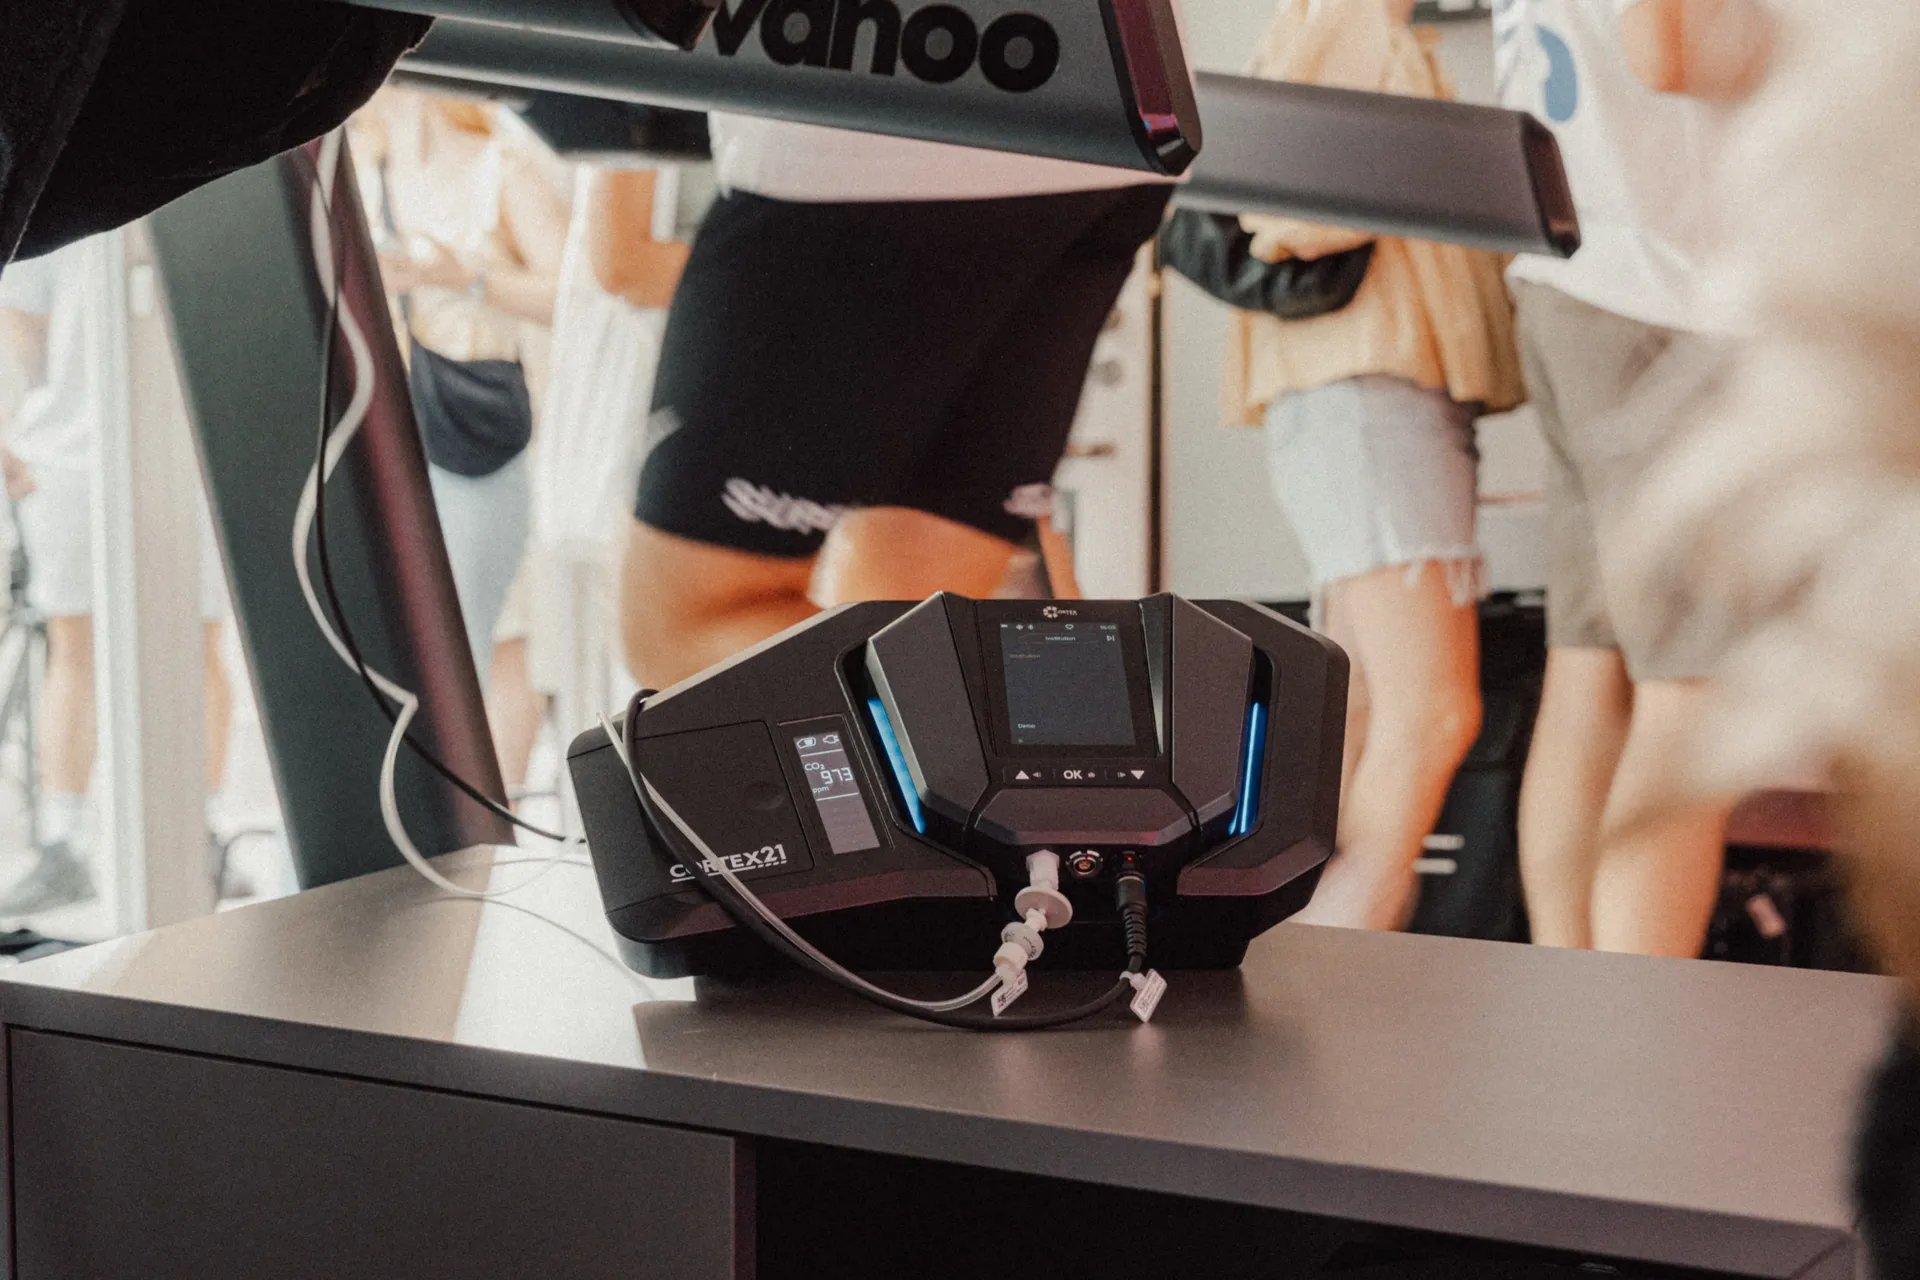
METALYZER®
Abstract anzeigen Abstract ausblenden
Beneficial metabolic and cardiovascular effects of anthocyanin-rich New Zealand blackcurrant (NZBC) were primarily observed in studies with female and male Caucasian participants. We examined the effects of 14-day intake of NZBC extract (daily 210 mg of anthocyanins) during supine rest and moderate-intensity treadmill walking in Southeast Asian women (n = 16, age: 23 ± 5 years, BMI: 22.9 ± 3.8 kg·m− 2, body fat (BF): 35 ± 5%). A randomized, double-blind, placebo-controlled, cross-over design was used. Beat-by-beat (PhysioFlow® Endure™) and breath-by-breath (Cortex Metalyzer 3B) measurements were recorded during 10-min of supine rest and 30-min of moderate-intensity treadmill walking (speed: 4.84 ± 1.00 km·h− 1). At rest, NZBC extract had no effect on the cardiovascular, physiological and metabolic responses. During moderate-intensity exercise, only lower systemic vascular resistance (15%) was observed in 50% of the participants based on the smallest worthwhile change analysis (P = 0.08 for the cohort with moderate effect size, d = 0.62). There was a significant correlation between fat oxidation during rest and moderate-intensity walking in the placebo and NZBC extract condition. There was a trend (P = 0.08) for the linear relationship between the walking-induced placebo respiratory exchange ratio and change in fat oxidation by intake of NZBC extract. In Southeast Asian women, 14-day anthocyanin-rich NZBC extract did not elicit consistent cardiorespiratory and metabolic effects, although some participants showed reduced systemic vascular resistance. It is possible that there was not the bioavailability of plasma anthocyanin-induced metabolites that could alter cell function for metabolic responses. Further research should optimize dosing strategies and examine the roles of ethnicity, sex, and anthocyanin-induced metabolite bioavailability in shaping responsiveness to the intake of anthocyanins.